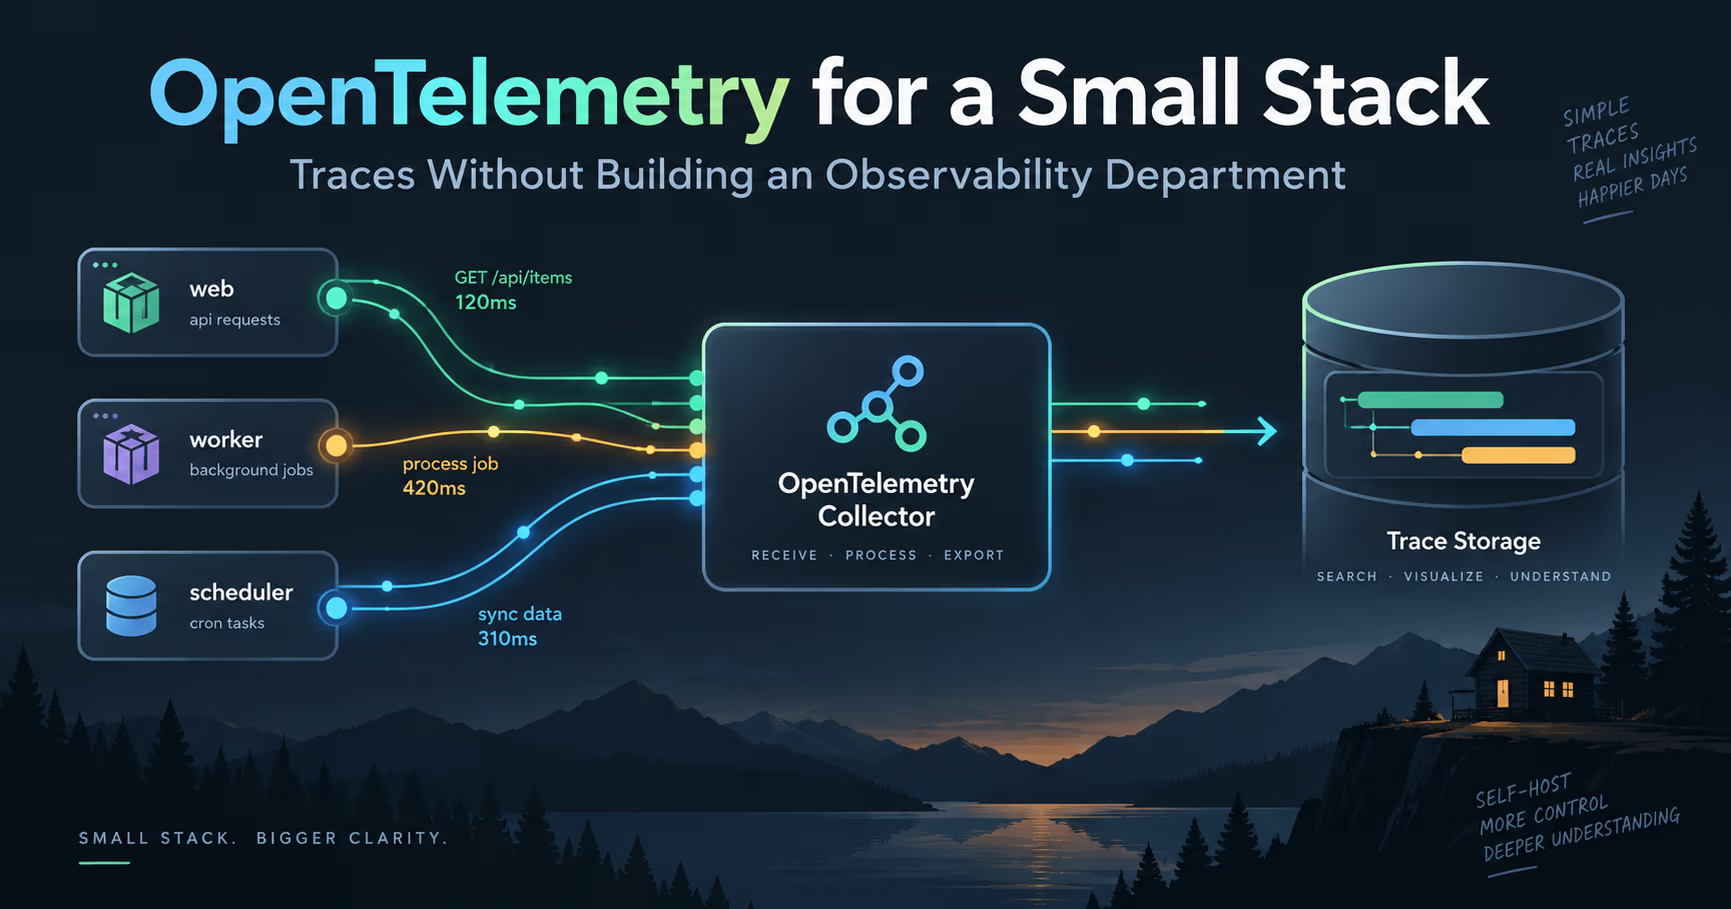
OpenTelemetry for a Small Stack: Traces Without Building an Observability Department
The common failure is not picking the wrong tool. It is assuming that doing OpenTelemetry properly means standing up Prometheus, Loki, Tempo, Grafana, a Collector fleet and a Kubernetes operator before you have read a single trace. You do not need that. For a small stack, OpenTelemetry is three moving parts: an SDK in your application, one Collector, and one place to store traces. Everything else is optional, and most of it stays optional for years.
This post is the sysadmin version: what the pieces actually are, the smallest config that works, how sampling decides whether traces cost you disk or nothing, where traces go, and the limits that bite when the whole pipeline runs on one box.
The short version
- OpenTelemetry is a standard, not a backend. It defines how you produce, transport and process telemetry. It does not store it, and it does not draw charts.
- OTLP is the wire protocol. Your application sends spans over OTLP to port 4317 (gRPC) or 4318 (HTTP), and the Collector, Tempo, Jaeger and most vendors all accept it. That one detail is what makes the backend swappable.
- The Collector is the one component worth running on day one. It receives OTLP, enriches, filters, samples and exports. One container, one YAML file, no cluster.
- Traces are the most expensive signal per byte. Sampling is the lever that keeps them affordable: head sampling in the SDK, tail sampling in the Collector for errors and slow requests.
- The backend is a choice, not a religion. Tempo if you already run Grafana, Jaeger v2 if you want the tracing UI and nothing else, SigNoz or OpenObserve if you want traces, logs and metrics in one ClickHouse-backed app.
- The limits are operational, not conceptual. Cardinality in span metrics, tail sampling topology, the Collector as a single point of failure, retention versus disk, and trace context your own code has to propagate.
- If your question is not about request paths, you probably do not need traces. Metrics answer whether the box is healthy, and OpenTelemetry is not required for that.
- OpenTelemetry Collector
v1.66.0 / v0.160.0 (latest release line) - OTLP
gRPC on 4317, HTTP on 4318 - Grafana Tempo
v3.0.3 (3.0 line) - Jaeger
v2.20.0 (released 2026-07-20) - Grafana Alloy
v1.19.2 - Tail sampling processor
beta stability for traces
Checked 2026-09-10 against the OpenTelemetry Collector releases page, the OpenTelemetry docs for the Collector, sampling concepts and OTLP, and the Tempo, Jaeger and Grafana Alloy release pages. The Collector ships most weeks, and both Tempo 3.0 and Jaeger v2 changed architectures recently, so pin image tags and re-check before you upgrade.
What OpenTelemetry actually is
OpenTelemetry, usually shortened to OTel, is a CNCF project that standardizes three things: the API and SDK your application uses to create telemetry, the OTLP protocol that carries it, and the Collector that processes it. It is deliberately not a storage system and not a user interface. The project's own documentation is explicit that the backend is yours to choose, which is the property that keeps you from being locked in.
The vocabulary is small and worth learning once. A trace is one request's journey. A span is one unit of work inside it, with a start time, a duration, a status and attributes. Spans form a tree through a trace ID and a parent span ID. Context propagation is how that trace ID travels from your reverse proxy, through your API, into your worker, and out to the database call.
What OTel is not: a metrics dashboard, a log store, an APM product, or a replacement for the backup discipline this blog keeps insisting on. It is the plumbing that makes those things possible with one instrumentation library instead of four vendor SDKs.
The four pieces, and which ones you actually run
The SDK, in your application
You add an OTel SDK to each service, set the service name and the OTLP endpoint, and instrument the libraries you already use.
For Node, Python, Go, Java, .NET and the rest, the auto-instrumentation packages cover HTTP servers and clients, database drivers and common frameworks, so you get useful spans without writing much code. The one line that matters most is the resource attribute service.name, because every backend groups, filters and alerts on it.
OTLP, the wire protocol
OTLP is the reason this stack is portable. Your application exports to an OTLP endpoint, and the Collector, Tempo, Jaeger, SigNoz and most commercial vendors all accept OTLP directly. Ports 4317 for gRPC and 4318 for HTTP are the convention, and yes, you can point an SDK straight at a backend and skip the Collector. Do that only for a first experiment: without the Collector you have no sampling, no batching, no retry, and no single place to see what your telemetry looks like before it reaches storage.
The Collector, the part worth running
The Collector is a single Go binary that receives, processes and exports telemetry.
A configuration is three sections. Receivers accept data, processors modify it, exporters send it somewhere. Connectors join pipelines together, and extensions add side services such as a health endpoint or a persistent queue. The core distribution ships a small set of components; the contrib distribution ships hundreds, including tail sampling and the span metrics connector. If you want a smaller binary, you can build your own distribution with the OpenTelemetry Collector Builder.
The backend, where traces live
This is the only piece you have to choose, and the only piece that costs real disk. The shortlist is below.
A Collector config you can copy
This is close to the smallest useful configuration for one box. It takes OTLP in, caps memory, batches, keeps a disk-backed queue so a restart does not lose data, and exports to a local Tempo instance. The file lives in git, and it is the whole deployment.
receivers:
  otlp:
    protocols:
      grpc:
        endpoint: 0.0.0.0:4317
      http:
        endpoint: 0.0.0.0:4318

processors:
  memory_limiter:
    check_interval: 1s
    limit_mib: 400
    spike_limit_mib: 100
  batch:
    timeout: 5s
    send_batch_size: 512

exporters:
  otlp/tempo:
    endpoint: tempo:4317
    tls:
      insecure: true

extensions:
  health_check:
    endpoint: 0.0.0.0:13133
  file_storage:
    directory: /var/lib/otelcol

service:
  extensions: [health_check, file_storage]
  pipelines:
    traces:
      receivers: [otlp]
      processors: [memory_limiter, batch]
      exporters: [otlp/tempo]
Three settings do most of the work. memory_limiter refuses data before the Collector is killed by the kernel, which matters on a 4 GB box. batch cuts network and storage overhead by sending spans in groups. file_storage gives the sending queue a disk-backed buffer, so an exporter restart or a Tempo upgrade does not become data loss. The health endpoint is what your monitoring points at, so a dead Collector is visible instead of silent.
$ docker run --rm -p 4317:4317 -p 4318:4318 \
    -v $PWD/otelcol.yaml:/etc/otelcol/config.yaml \
    otel/opentelemetry-collector-contrib:0.160.0

# in another shell, send one span over OTLP/HTTP
$ curl -s http://localhost:4318/v1/traces \
    -H 'Content-Type: application/json' \
    -d '{"resourceSpans":[]}'

# the collector health endpoint answers with an empty 200
$ curl -s -o /dev/null -w '%{http_code}\n' http://localhost:13133
Sampling: the lever that keeps traces affordable
A trace with 40 spans at 200 bytes each is 8 KB before attributes. Multiply by requests per second and you have a disk problem. The good news is that you rarely need every trace, and OTel gives you two places to decide.
Head sampling happens in the SDK, before the trace leaves the process. Parent-based trace ID ratio sampling keeps whole traces consistent: set a ratio, and the decision propagates, so you never get half a trace. It is cheap and it runs at the source, but it is blind. It cannot know that this particular trace will end in an error.
Tail sampling happens in the Collector, after all spans of a trace have arrived. The tail_sampling processor, still marked beta for traces, buffers traces for decision_wait seconds and applies policies. The three useful ones are status_code for errors, latency for slow requests, and probabilistic for a background sample. Together they give you every failure, every slow request, and a small percentage of everything else, which is exactly the data you need to debug and almost nothing you do not.
processors:
  tail_sampling:
    decision_wait: 10s
    num_traces: 50000
    policies:
      - name: errors
        type: status_code
        status_code:
          status_codes: [ERROR]
      - name: slow
        type: latency
        latency:
          threshold_ms: 500
      - name: baseline
        type: probabilistic
        probabilistic:
sampling_percentage: 5The honest trade: tail sampling costs memory, because the Collector holds traces in flight for the decision window. On a small box, 10 seconds and 50,000 traces is a reasonable starting point. Measure the Collector's own memory and tune it, because the Collector is the component that will run out of memory first.
Where traces actually go
The shortlist for a self-hosted stack, and the trade each one makes.
| Feature | Grafana Tempo | Jaeger v2 |
|---|---|---|
| Storage | Object storage or local disk, block-based | Memory, Badger, Cassandra, Elasticsearch or OpenSearch |
| Query and UI | TraceQL and search inside Grafana | Built-in Jaeger UI and service graphs |
| Operational shape | Single binary or microservices, plus a Grafana instance | One binary built on the OpenTelemetry Collector framework |
| Extra dependency | Grafana for the UI | None beyond the Jaeger binary |
| Best for | Stacks already running Grafana and Prometheus | A trace-only deployment with no Grafana |
| Version checked1 | v3.0.3 | v2.20.0 |
Storage
- Grafana Tempo
- Object storage or local disk, block-based
- Jaeger v2
- Memory, Badger, Cassandra, Elasticsearch or OpenSearch
Query and UI
- Grafana Tempo
- TraceQL and search inside Grafana
- Jaeger v2
- Built-in Jaeger UI and service graphs
Operational shape
- Grafana Tempo
- Single binary or microservices, plus a Grafana instance
- Jaeger v2
- One binary built on the OpenTelemetry Collector framework
Extra dependency
- Grafana Tempo
- Grafana for the UI
- Jaeger v2
- None beyond the Jaeger binary
Best for
- Grafana Tempo
- Stacks already running Grafana and Prometheus
- Jaeger v2
- A trace-only deployment with no Grafana
Version checked1
- Grafana Tempo
- v3.0.3
- Jaeger v2
- v2.20.0
- checked 2026-09-10
- Tempo. The 3.0 line is a major release that changed the ingest and write architecture and removed deprecated 2.x components, so read the migration notes before you upgrade an existing install. For a new small deployment, single-binary mode with local storage is the easy path, and Grafana is your UI.
- Jaeger v2. Since v2 the whole project is built on the OpenTelemetry Collector framework, which means the Jaeger binary is a Collector with the Jaeger UI and storage attached. If you want a self-contained tracing UI with no Grafana dependency, this is the simplest thing to run.
- SigNoz and OpenObserve. ClickHouse-backed platforms that accept OTLP and give you traces, logs and metrics in one application. More components, more disk, and a genuinely better out-of-the-box experience if you want one tool instead of three.
- Uptrace and hosted free tiers. Uptrace is a smaller OTLP-native option if you want traces and metrics without Grafana. And if the goal is to learn OTel rather than to own the storage, point the Collector at a free hosted OTLP endpoint: the instrumentation is identical and only the exporter changes.
My own default, and the one this post is built around: Collector plus Tempo plus Grafana, because it reuses the Grafana instance you probably already have and Tempo's local storage mode is enough for months of sampled traces.
Running it on one box
Docker Compose is the right shape here, for the same reasons the Compose vs Kubernetes post gives: one host, a handful of services, no scheduler needed. A minimal stack is Tempo, the Collector and Grafana, with a named volume for Tempo's data and one for the Collector's file storage.
services:
  tempo:
    image: grafana/tempo:3.0.3
    command: ["-config.file=/etc/tempo.yaml"]
    volumes:
      - ./tempo.yaml:/etc/tempo.yaml
      - tempo-data:/var/tempo
    ports:
      - "127.0.0.1:3200:3200"

  otelcol:
    image: otel/opentelemetry-collector-contrib:0.160.0
    volumes:
      - ./otelcol.yaml:/etc/otelcol/config.yaml
      - otelcol-data:/var/lib/otelcol
    ports:
      - "127.0.0.1:4317:4317"
      - "127.0.0.1:4318:4318"
      - "127.0.0.1:13133:13133"

  grafana:
    image: grafana/grafana:latest
    ports:
      - "127.0.0.1:3000:3000"
    volumes:
      - grafana-data:/var/lib/grafana

volumes:
  tempo-data:
  otelcol-data:
  grafana-data:
Two deliberate choices. Every port binds to loopback, because the trace pipeline should never be reachable from the network, and the same reverse proxy and TLS layer that fronts your other services can expose Grafana. And the Tempo retention window is a config line, not a guess: set a short block retention window and let sampling decide what fills it. If the pipeline needs to be reachable from another host, the NetBird and Pangolin comparison is a better answer than opening a port.
Then verify the pipeline end to end before you trust it with a real incident.
$ docker compose up -d
$ docker compose ps

# collector health
$ curl -s -o /dev/null -w '%{http_code}\n' http://localhost:13133
200

# tempo readiness
$ curl -s http://localhost:3200/ready
ready

# then send one trace from your app and open Grafana Explore
What breaks first
- Cardinality in span metrics. The span metrics connector turns spans into Prometheus metrics, which is the cheapest way to get latency dashboards. Every span attribute you route there becomes a label. Put user IDs, full URLs or request IDs on it and your metrics backend grows without bound. Keep the dimensions small: service, operation, status code, and maybe deployment environment.
- The Collector as a single point of failure. Every service ships to one process on one box. If it dies you lose telemetry, not traffic, which is the right ordering, but put the health endpoint in your monitoring and a restart policy on the container. Do not put the Collector behind the reverse proxy you are trying to observe.
- Disk and retention math. Traces are the signal that grows fastest. Sampled traces plus a short retention window is the only configuration that survives a year on a small disk. If you care about history, back up the trace store, because the backup discipline applies to observability data too.
- Broken context propagation. A trace that stops at your API gateway is not a trace. If your proxy, queue or background worker does not forward the trace context header, you get disconnected islands. This is the most common reason a tracing rollout disappoints, and it is a code and configuration problem, not a Collector problem.
- Version churn. The Collector ships a release most weeks, the dual v1.x and v0.x versioning is confusing by design, and both Tempo 3.0 and Jaeger v2 changed architectures. Pin image tags, read the release notes, and track them the way the release-tracking workflow describes.
- Secrets in attributes. Span attributes land in a database you will later query, share and back up. Never put tokens, passwords or full personal data in a span attribute, and treat the Collector config as code, because it is the one place every service's telemetry passes through.
When not to do this
- Your question is whether the box is healthy. Metrics and a node exporter answer that. Traces answer why a request was slow, and if that is not your question, OTel is a project you do not need yet.
- You have one service. A single process with structured logs and a request ID gets you most of the way. Add the SDK when you have a second service or a queue.
- You need compliance-grade retention and audit. A managed platform or hosted vendor is the honest answer, because long retention, access control and audit are exactly what you are paying them for.
- You cannot spare the memory. Tail sampling and a trace backend want RAM. On a 2 GB VPS, run metrics and logs first and revisit traces when you upgrade.
- You already pay for a platform. If your team has a hosted observability product, instrument with OTel and export there. The standard is the point; you do not have to run the storage.
Which should you pick?
- Collector plus Tempo plus Grafana: the default for this blog. It reuses Grafana, local storage is enough for a small stack, and TraceQL inside Grafana Explore is a good debugging loop.
- Collector plus Jaeger v2: choose it when you want a self-contained tracing UI with no Grafana dependency, or when you already know Jaeger.
- Collector plus SigNoz or OpenObserve: choose it when you want one application for traces, logs and metrics and you are willing to run ClickHouse.
- OTel SDK straight to a hosted endpoint: choose it when you are learning the instrumentation and do not want to operate storage yet. Keep the Collector config in the repo anyway, so switching later is an exporter change.
- Nothing: choose it when your actual problem is metrics, logs or backups. Adding traces to a stack that cannot answer its current questions is how observability departments get built by accident.
The point of OpenTelemetry is not to run a platform. It is to stop rewriting your instrumentation every time the backend changes. One SDK per service, one Collector on the box, one place to look, and a sampling policy that keeps errors and drops the boring traffic. That is a weekend of work, not a department.
Official sources
- OpenTelemetry Collector documentation: https://opentelemetry.io/docs/collector/
- OpenTelemetry Collector releases: https://github.com/open-telemetry/opentelemetry-collector/releases
- OTLP specification: https://opentelemetry.io/docs/specs/otlp/
- Sampling concepts, head and tail: https://opentelemetry.io/docs/concepts/sampling/
- Tail sampling processor: https://github.com/open-telemetry/opentelemetry-collector-contrib/tree/main/processor/tailsamplingprocessor
- Grafana Tempo documentation: https://grafana.com/docs/tempo/latest/ and releases: https://github.com/grafana/tempo/releases
- Jaeger v2 documentation: https://www.jaegertracing.io/docs/latest/ and releases: https://github.com/jaegertracing/jaeger/releases
- Grafana Alloy documentation: https://grafana.com/docs/alloy/latest/
- SigNoz documentation: https://signoz.io/docs/
- Our Compose vs Kubernetes post: https://systhoughts.com/posts/docker-compose-vs-kubernetes-self-hosted-apps
- Our Docker vs Podman post: https://systhoughts.com/posts/docker-vs-podman-self-hosted-apps
- Our backup and recovery keys post: https://systhoughts.com/posts/3-2-1-backup-rule-not-enough-self-hosted-infrastructure
- Our release-tracking workflow: https://systhoughts.com/posts/tracking-software-releases-across-forges
Are you running traces on a small stack, or did you stop at metrics and logs? What made tail sampling worth the memory for you? Drop it in the comments.
Until next time, keep your systems thoughtful.
No comments yet