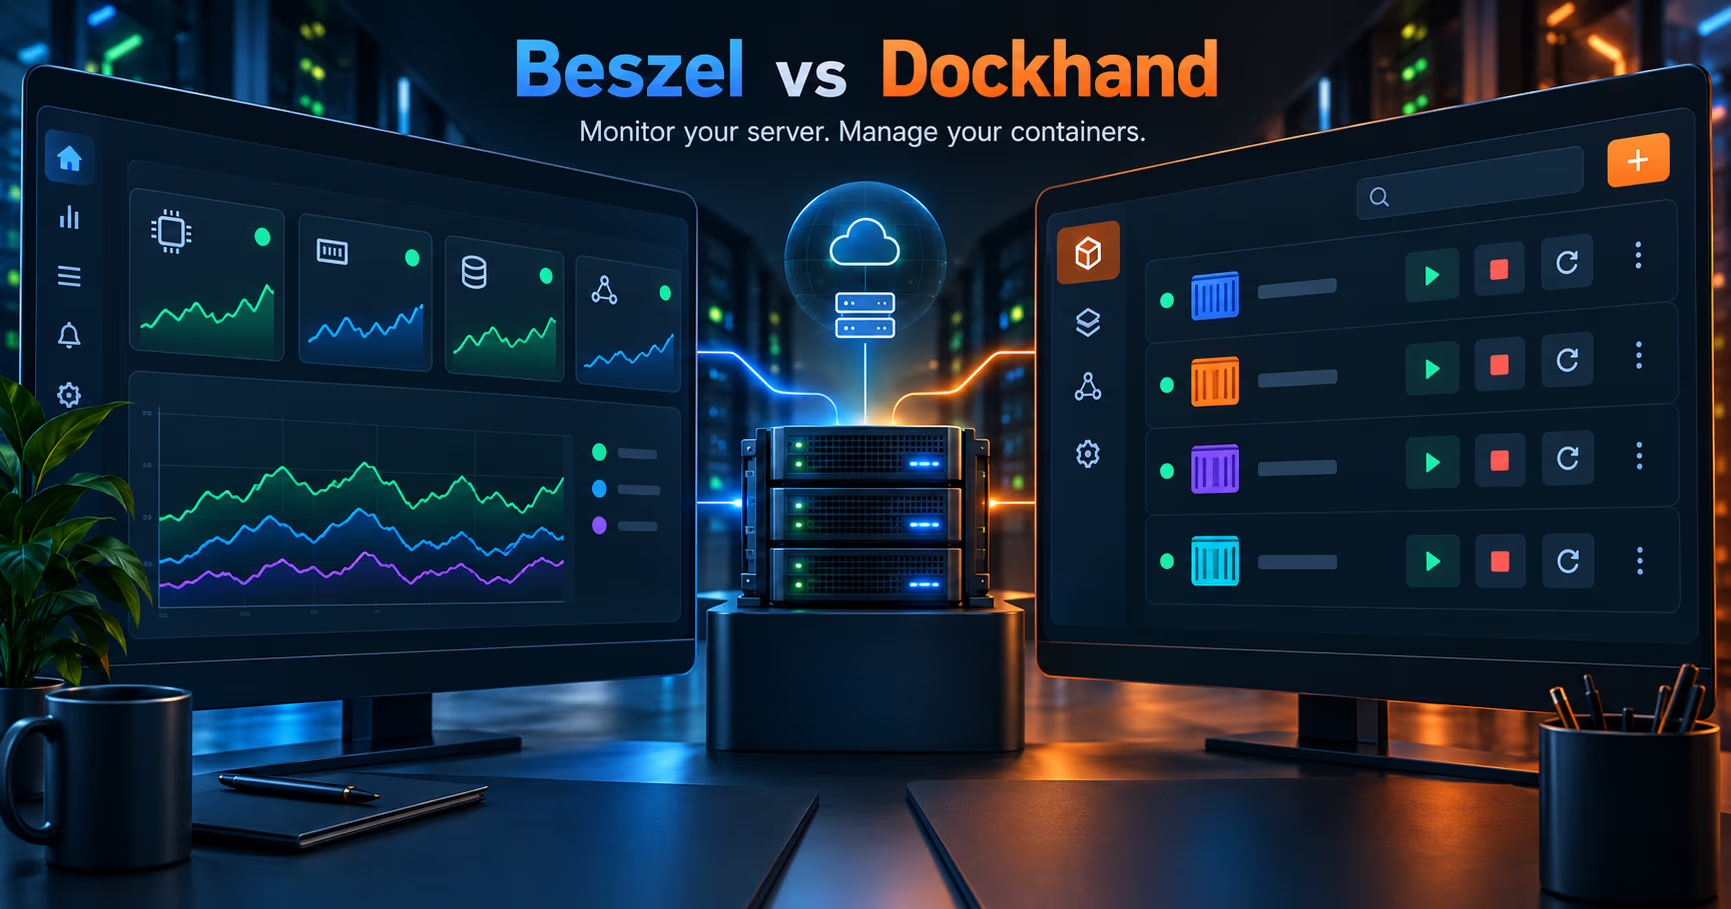
What do you run to know whether the box is healthy, and what do you run to actually change things on it? Two names keep appearing in the same Reddit threads and the same docker-compose folders: Beszel and Dockhand.
Both are small, self-hosted, single-container tools with a friendly web UI, so the obvious question is which one replaces the other. The honest answer is that they do not compete.
Beszel watches the server. Dockhand runs the containers. This post compares the two directly, then puts the lightweight claim under a measuring tape and lines both up against the more common alternatives: Netdata, Grafana plus Prometheus, Glances, Uptime Kuma, and Dozzle.
The short version
- Beszel is a monitoring tool. A Go hub plus one small agent per host, tracking CPU, memory, disk, network, temperature, GPU, ZFS, S.M.A.R.T., and per-container Docker and Podman stats, with historical data and alerts. MIT licensed.
- Dockhand is a management tool. A Docker UI for starting, stopping, restarting, and composing containers, with logs, a terminal, a file browser, git deploys, and multi-host support. Source available under BSL 1.1, converting to Apache-2.0 in 2029.
- They are complements, not rivals. Beszel answers "is my server healthy?" Dockhand answers "show me the containers and let me change them." You can run both on one box and they never touch the same job.
- The lightweight claim checks out. Third-party measurements put the Beszel hub around 12-30 MB and the agent around 8-15 MB, against 200-500 MB per Netdata agent and 400 MB-plus for a Grafana and Prometheus stack.
- The common alternatives are not interchangeable either. Glances is a terminal dashboard, Uptime Kuma is uptime checks, Dozzle is logs, cAdvisor is container metrics. Same category, different problems.
- The decision rule: if you want history and alerts in a five minute setup, pick Beszel. If you want a comfortable Docker UI, pick Dockhand. Usually the honest answer is both.
What Beszel actually is
Beszel describes itself as a lightweight server monitoring platform that includes Docker statistics, historical data, and alert functions. Architecture is two parts: the hub, a web application built on PocketBase that provides the dashboard, and the agent, a single Go binary that runs on each system you want to monitor and pushes metrics to the hub. Either part can run from a binary or from Docker, and the agent does not need to be exposed to the internet: it connects out to the hub over SSH or a unix socket, or with a universal token since version 0.12.0.
While I was writing this, the project README listed: host and per-container CPU, memory, disk usage and disk I/O, network, load average, temperature and fan speed, GPU usage and power draw for Nvidia, AMD, and Intel, battery, S.M.A.R.T. disk health, ZFS pool capacity and health, and Docker and Podman container metrics. Alerts are configurable for CPU, memory, disk, bandwidth, temperature, fan speed, load average, and status, and they route through the usual lineup of channels: Discord, Telegram, email, ntfy, Slack, Matrix, and the rest. There is multi-user support, OAuth and OIDC with the option to disable password auth entirely, automatic backups to disk or S3-compatible storage, and a REST API.
The install path is the part that sells sysadmins on it. From the getting-started guide:
$ mkdir beszel && cd beszel
$ curl -L https://github.com/henrygd/beszel/releases/latest/download/beszel_Linux_x86_64.tar.gz | tar -xz
$ ./beszel serve
# on each monitored host
$ curl -L https://github.com/henrygd/beszel/releases/latest/download/beszel-agent_Linux_x86_64.tar.gz | tar -xz
$ KEY="$(cat ~/.ssh/id_ed25519.pub)" ./beszel-agent
The web UI prompts you to create the admin user, add a system, and copy the agent command. The installer creates a beszel user, sets up a service that survives reboots, and offers daily automatic updates. That is the whole setup; there is no PromQL, no scrape config, no dashboard JSON to hand-maintain.
What Dockhand actually is
Dockhand describes itself as a modern, efficient Docker management application: real-time container management, Compose stack orchestration, and multi-environment support, in a lightweight, secure, and privacy-focused package. It is positioned as a Portainer replacement, and that is the category it lives in.
The README lists container start, stop, restart, and real-time monitoring; a visual editor for Compose stacks; git integration that deploys stacks from repositories with webhooks and auto-sync; multi-environment support for local and remote Docker hosts over socket, agent, or direct TCP; an interactive terminal and real-time log streaming; a file browser into containers; an image and volume browser; vulnerability scans with Grype and Trivy; cron-style schedules for pruning, updates, and cleanup; and an activity log. Authentication covers OIDC SSO and local users, with RBAC gated as an enterprise feature. The stack is SvelteKit with Svelte 5 on the Bun runtime, SQLite or PostgreSQL via Drizzle, and direct calls to the Docker API, packaged on a minimal Wolfi base image.
One detail matters before you adopt it: the license. Dockhand is not MIT. It ships under the Business Source License 1.1, free for personal use, internal business use, non-profits, education, and evaluation, with the one restriction that you cannot offer it as a commercial SaaS or hosted service. The project converts to Apache-2.0 on January 1, 2029. For a homelab or an internal tool that restriction changes nothing today, and it disappears in a few years anyway, but it is exactly the kind of term people discover after they have built a business on the thing.
Why they are not rivals
The confusion is fair. Both tools are small, self-hosted, Docker-era, single-container, web-UI products that show up in the same "what should I run on my server" discussions. The similarity ends at the job each one does.
Dockhand's monitoring is a dashboard of the present. It shows live CPU, memory, and disk metrics per environment while you are managing it, the same way docker stats does. It is not historical data, and it does not page you. Beszel's monitoring is a historian with an alarm. It keeps time series you can look back over days or weeks, tracks each container's usage over time, and fires alerts when a threshold breaks, which is the part that actually wakes you up at 3am.
And the reverse: Beszel deliberately does not touch containers. It reads metrics the way a thermometer reads a room. It does not start, stop, edit, or redeploy anything. Dockhand does exactly those mutations. One watches, one steers, and a healthy homelab usually wants both.
| Feature | Beszel | Dockhand |
|---|---|---|
| Primary job | Monitor hosts and containers | Manage containers and Compose stacks |
| Data model | Historical time series, stored on the hub | Live state and resources of Docker hosts |
| Docker stats | Per-container CPU, memory, network history | Live container status and resource view |
| Alerts | CPU, memory, disk, bandwidth, temperature, fan, load, status | None; it is a management tool |
| Agent | beszel-agent per host, Go binary, connects out | Remote Docker hosts via socket, agent, or TCP |
| License | MIT | BSL 1.1, Apache-2.0 from Jan 2029 |
| Footprint | Hub ~12-30 MB, agent ~8-15 MB (measured) | 150 MB-plus per install (reported) |
| Best for | "Is the server healthy, and what happened last night?" | "Give me a UI for the containers" |
Primary job
- Beszel
- Monitor hosts and containers
- Dockhand
- Manage containers and Compose stacks
Data model
- Beszel
- Historical time series, stored on the hub
- Dockhand
- Live state and resources of Docker hosts
Docker stats
- Beszel
- Per-container CPU, memory, network history
- Dockhand
- Live container status and resource view
Alerts
- Beszel
- CPU, memory, disk, bandwidth, temperature, fan, load, status
- Dockhand
- None; it is a management tool
Agent
- Beszel
- beszel-agent per host, Go binary, connects out
- Dockhand
- Remote Docker hosts via socket, agent, or TCP
License
- Beszel
- MIT
- Dockhand
- BSL 1.1, Apache-2.0 from Jan 2029
Footprint
- Beszel
- Hub ~12-30 MB, agent ~8-15 MB (measured)
- Dockhand
- 150 MB-plus per install (reported)
Best for
- Beszel
- "Is the server healthy, and what happened last night?"
- Dockhand
- "Give me a UI for the containers"
The lightweight argument, with numbers
The "lightweight" label is the whole pitch, so it deserves a measuring tape. I did not run my own benchmark for this post; the numbers below come from third-party tests published in 2026, and the project's own claims are marked separately. Treat them as ranges, because RAM varies by hardware, agent count, and what you asked the tool to remember.
Tool | Idle RAM, measured | Notes |
|---|---|---|
Beszel hub | 12-30 MB | third-party benchmarks, 2026 |
Beszel agent | 8-15 MB | project markets "under 10 MB"; reviewers measured 8-23 MB |
Dockhand | 150 MB-plus per install | third-party review, vs under 100 MB for Portainer |
Netdata | 200-500 MB per agent | measured ranges in multiple reviews |
Grafana + Prometheus | 400 MB-1 GB combined | plus exporters on every monitored host |
Glances | around 50 MB | terminal dashboard |
Uptime Kuma | 30-80 MB | one container, checks many targets |
Dozzle | around 10 MB | log viewer only |
cAdvisor | 50-150 MB | container metrics exporter |
Why this matters on real hardware: on a 2 GB VPS, a 320 MB Netdata agent is 16% of your RAM gone before any user code runs, and a Grafana and Prometheus stack is a second tenant on the box. On a Raspberry Pi or a $5 VPS that is the entire difference between monitoring being invisible and monitoring becoming a job. And the arithmetic multiplies: Beszel's per-host cost is one small agent, while the Grafana route needs a heavy central store and exporters on every machine. For a fleet of 5-20 small hosts, that is the difference between a rounding error and a line item.
The honest caveat: the project's own "under 10 MB" language for the agent is marketing-adjacent. Independent tests put it between about 12 and 23 MB depending on the box. The number is still tiny compared to the alternatives, but quote the measured range, not the pitch.
- Beszel
0.19.0 - Dockhand
main branch
Verified against beszel.dev guide 0.19.0 and both project READMEs on this date.
Vs the common alternatives
Beszel is not the only light option, and the alternatives are not wrong; they are aimed at different problems that all get filed under "monitoring."
- Netdata is the depth-first opposite. It auto-detects everything, shows thousands of charts by default, and samples at second granularity, at the cost of 200-500 MB per agent and information you will scroll past. It is genuinely useful on a 50-node production SaaS, and overkill for asking "is my CPU OK."
- Grafana + Prometheus is the recognized classic: Prometheus scrapes, Grafana renders, PromQL queries, and nothing is automatic. You install one to make the other useful, add exporters on every host, and spend weekends learning a query language (ok, not true anymore since LLMs). Its strength is that it scales to real infrastructure and you control every metric. Beszel is the opposite bet: fixed metric set, zero query language, five minutes to first chart.
- Glances is a terminal-based dashboard with a small footprint, excellent when you SSH in and want a live view. It does not keep meaningful history or page you, so it complements Beszel more than it competes.
- Uptime Kuma checks whether an endpoint is reachable, not how the machine feels. It answers "is the service up" with rich notifications, and it deliberately has no resource history. The classic pairing is Uptime Kuma for availability plus Beszel for resource health.
- Dozzle is a real-time log viewer, around 10 MB, and it does one thing well. Monitoring tools are notoriously bad at logs, and Beszel does not do logs at all, so Dozzle slots in next to it naturally.
- cAdvisor exports per-container metrics to Prometheus; it is a building block, not a product, and it belongs to the Grafana world.
The pattern worth noticing: the common alternatives each cover one slice, and the light stack that covers the same ground as a full Grafana deployment is Beszel for health and history, Uptime Kuma for uptime, and Dozzle for logs, all three under the memory budget of a single Netdata agent.
The limits that bite
- No arbitrary application metrics. Beszel measures what it ships: host, container, GPU, ZFS, S.M.A.R.T. It does not accept custom application-defined metrics, which is an open feature request rather than a planned gap. If your app needs its own counters, that is Prometheus territory.
- No log handling. Covered above; budget a log viewer alongside it.
- History lives in SQLite on the hub. Retention depends on the disk you give the hub, and the database is the whole story. Back it up, keep a copy offline, and test the restore, the way the 3-2-1 backup post insists.
- The agent needs to see the Docker socket for container stats. It mounts read-only, which is the right call, but a socket mount is still a socket mount; audit the host before you add it to a box holding other things.
- Alerting is threshold-based, not query-based. "Page me when CPU stays above 90%" is exactly its job. "Page me on this complex correlation" is not; there is no PromQL-style rule engine.
- Both projects are moving fast. Beszel was at around 25.5k stars and 1,600 commits when I checked, Dockhand at around 6.2k stars and 421 commits. Version churn is real in both, so pin what you run and track releases the way the release-tracking workflow describes.
Which should you pick?
- Choose Beszel when you want to know whether your servers are healthy, what happened last night, and whether a container is eating memory, with alerts that reach you and a setup measured in minutes. It is the default for 1-20 small hosts.
- Choose Dockhand when you want a comfortable UI for containers, Compose stacks, logs, terminals, and git deploys, and you would rather click than SSH. It replaces Portainer, not Beszel.
- Choose Netdata when you run production on many nodes and genuinely read thousands of per-second charts. On a homelab it is usually 20-50x the footprint for information you will not read.
- Choose Grafana + Prometheus when you need custom application metrics, PromQL, and a stack that scales to real infrastructure, and you have the time budget. It is a platform; Beszel is a tool.
- Choose Uptime Kuma and Dozzle as neighbors, not replacements. Availability checks and logs are different jobs, and both fit next to Beszel under one small memory budget.
- Run Beszel and Dockhand together. They do not fight; the monitor reads, the manager writes, and the same box hosts both comfortably.
My honest read after going through both repos and the measurements: Beszel is the lightest way to get historical data and alerts on a small fleet, Dockhand is the lightest comfortable container management UI, and the common alternatives earn their weight only when their depth is actually on the job. Pick the tool that matches the question you are asking, and let the two specialists share the box.
Official sources
- Beszel: https://beszel.dev and https://github.com/henrygd/beszel
- Beszel getting-started guide: https://www.beszel.dev/guide/getting-started
- Dockhand: https://dockhand.pro and https://github.com/Finsys/dockhand
- Netdata: https://www.netdata.cloud
- Grafana: https://grafana.com and Prometheus: https://prometheus.io
- Glances: https://github.com/nicolargo/glances
- Uptime Kuma: https://github.com/louislam/uptime-kuma
- Dozzle: https://github.com/amir20/dozzle
- Our Docker vs Podman post: https://systhoughts.com/posts/docker-vs-podman-self-hosted-apps
- Our Compose vs Kubernetes post: https://systhoughts.com/posts/docker-compose-vs-kubernetes-self-hosted-apps
Are you running Beszel next to Dockhand, or did the Grafana route win your stack first? Where did the lightweight argument survive contact with your actual servers? Drop it in the comments.
Until next time, keep your systems thoughtful.
No comments yet